Ethereum’s Summer 2026 Movements
During the summer of 2026, Ethereum’s Aggregated Top-10,000 gained $13.9B in dollar value while holding almost 0.9M less native ETH. Over the same period, active Ethereum staking added 3.6M ETH. The rebound in dollar balances tells only part of the story: the composition, use and concentration of capital also changed.
Using snapshots from June 1, July 1, August 1 and September 1, this analysis examines what drove the recovery across large addresses, project tokens, staking and smart contracts — and where the strongest observed growth occurred.
The analysis uses Ethplorer’s Aggregated Ethereum Address Rich List, based on totalBalanceUsd: the combined USD value of native ETH and ERC-20 assets, including stablecoins. Unlike traditional ETH-only rankings based on ethBalanceUsd, the Aggregated Rich List captures the broader asset mix. The Top-10,000 is recalculated for each monthly snapshot, so the address set may change between dates. Token contracts are excluded from the main ranking.
Richer in dollars, poorer in ETH
The dollar value of the Aggregated Top-10,000 traced a V-shaped arc: $339.3B on June 1, a trough of $293.7B on July 1, then a recovery to $303.8B in August and $353.2B by September 1. A $13.9B net gain over the season.
However, their holdings of native ETH moved in the opposite direction. Over the summer, native ETH fell from approximately 54.1M to 53.1M ETH — a drop of nearly 0.9M ETH, or 1.7%.
August was particularly telling. In dollar terms, the ETH component of the Top-10,000 addresses surged by 32.8% — from $98.6B to $131.0B. At first glance, this might look like heavy ETH accumulation by major holders. Yet physical ETH holdings barely grew: roughly 99% of the dollar increase in the ETH component was driven solely by the price revaluation of existing ETH.
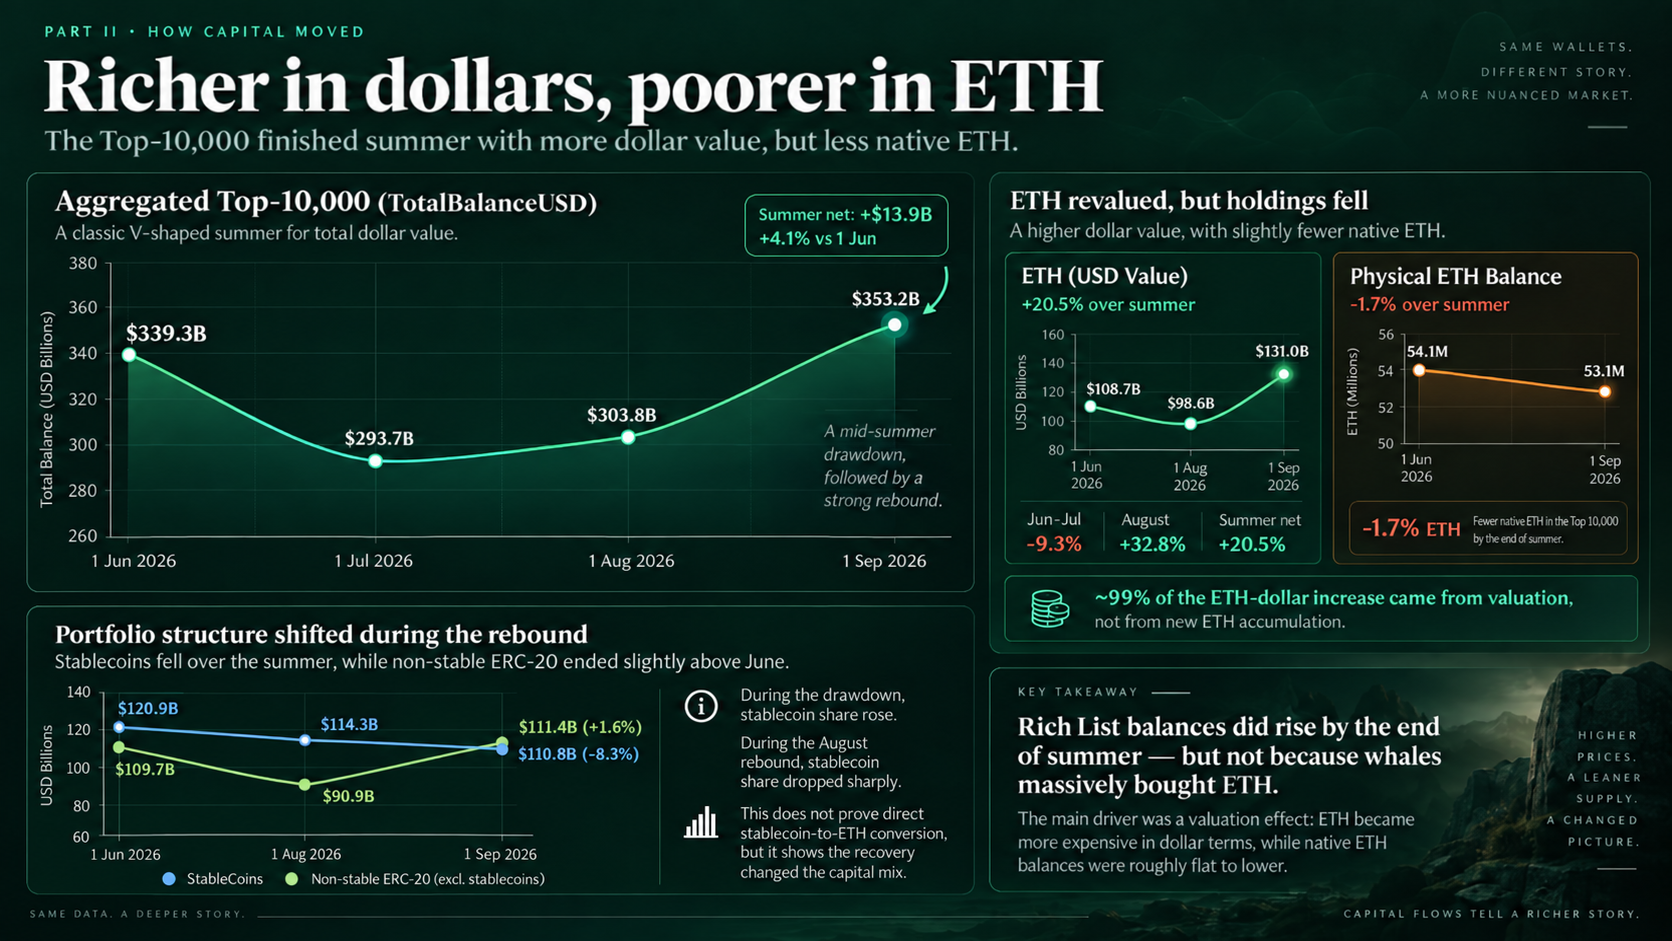
In short, the Rich List did grow wealthier — but not because whales were aggressively buying ETH. It was primarily a valuation effect.
Portfolio composition also shifted. Stablecoin balances fell by 8.3% over the summer, while non-stable ERC-20 tokens ended the season roughly 1.6% above June levels. During the mid-summer drawdown, the share of stablecoins rose, but it dropped sharply during the August rebound. While this does not prove a direct conversion of stablecoins into ETH, it demonstrates that the recovery was not a simple reset of prices to baseline: the structure of observed capital underwent a clear shift.
When project growth is its own token
To distinguish external capital from value tied to a project’s own token, the analysis uses the Printing Press Index (PPI).
PPI = Own-token value / Total ERC-20 value across attributed project addresses.
PPI is calculated for each project’s attributed addresses in the summer 2026 dataset. Native ETH is excluded from the denominator; stablecoins and other ERC-20 assets are included.
The higher the PPI, the more of a project’s token balance comes from its own token — and the more carefully one must interpret Aggregated balance growth as an inflow of external capital.
Summer data illustrates how drastically this alters the interpretation of “project growth.”
Uniswap ended the summer up roughly $773M (+39.5%). However, about $648M of this increase came from its native UNI token — accounting for roughly 84% of the total gain. The project's PPI rose from 45.9% to 57.3%.
For Chainlink, the effect was even more pronounced: total attributed balance grew by approximately $507M, while the value of LINK held on the project's own addresses increased by $550M. In other words, native token growth accounted for 108.6% of the entire net gain: all other observed assets held by the project collectively shrank over the period. PPI climbed from 89.8% to 92.4%.
World Liberty Financial, a crypto project co-founded by members of the Trump family, presents an extreme example of another kind. By September 1, roughly $3.8B of its ERC-20 value consisted of its native WLFI token, pushing its PPI to 98.2%.
That value is economically real — but it is not equivalent to external capital. $1B in external assets and $1B in a project’s own token represent very different balance sheets.
That is precisely why the next stage of Rich List analysis goes beyond measuring totalBalanceUsd to evaluating the quality of growth: dissecting what actually drove the increase in balance.
ETH didn’t accumulate in the Rich List — it became productive
While the first section demonstrates that the largest liquid addresses were not accumulating native ETH, the staking layer reveals the exact opposite trend.
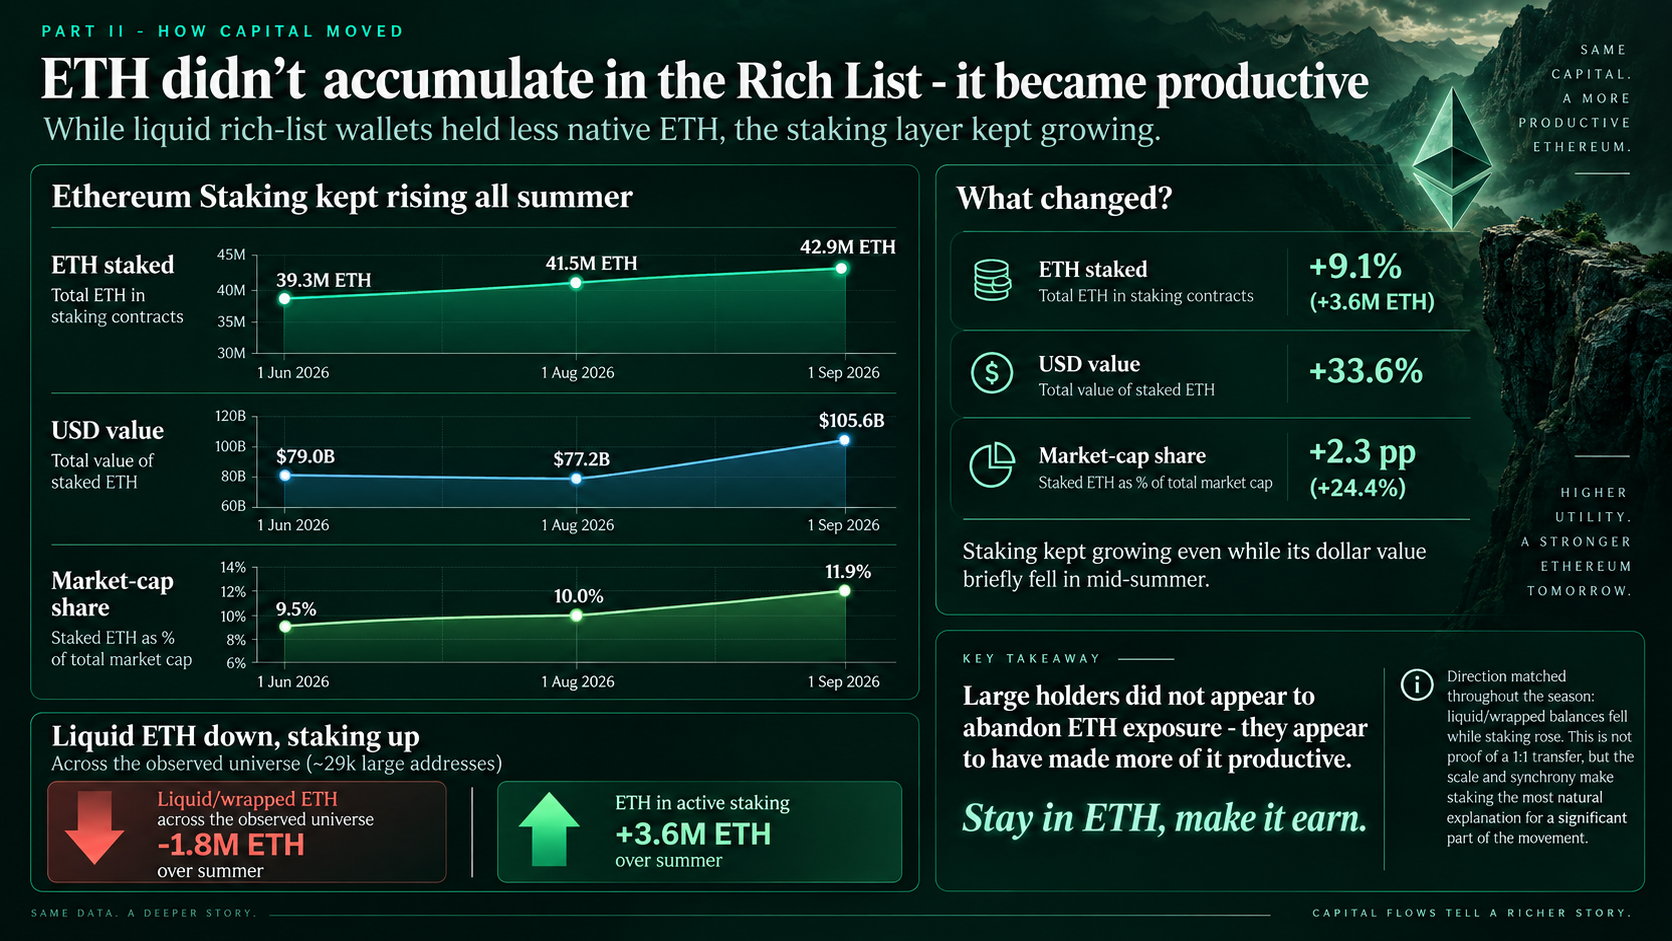
Market-cap share refers to total market cap (ETH + tokens), not ETH supply alone.
Over the summer, active staking grew from 39.3M to 42.9M ETH — an increase of 3.6M ETH, or 9.1%. Notably, staking continued to climb even during periods of declining dollar valuations: by August 1, staked ETH had already risen to 41.5M, despite its total USD value dropping from $79.0B to $77.2B.
To test this contrast, the analysis expands the lens beyond the Top-10,000. Across the broader observed universe of roughly 29k large addresses — temporarily re-including token contracts to account for underlying ETH within the WETH contract — liquid and wrapped ETH balances fell by approximately 1.8M ETH over the summer. Meanwhile, staking absorbed an additional 3.6M ETH.
The directional shift was consistent month after month: liquid/wrapped balances declined while staking expanded. While it is impossible to trace every individual ETH unit directly to a specific validator deposit, prohibiting definitive proof of a 1:1 transfer, the sheer scale and synchronicity position staking as the most natural explanation for a major portion of this movement.
ETH was leaving liquid balances — but staking suggests much of it was being put to work, not simply leaving the ecosystem.
Ether.fi: The Same Staked ETH in a New Form
The case of Ether.fi (a liquid restaking protocol) shows how the staking stack itself was being reshaped. Its attributed balance jumped from $229M to $1.2B, but 97.6% of that increase appeared in a single official Restaker contract (0x1b7a...6fff) — meaning the change largely reflected where existing staked capital became visible, rather than a fivefold increase in TVL.
That restructuring followed a severe spring stress test: Ether.fi processed withdrawals equal to 19.6% of its starting TVL after the Kelp rsETH incident. By August, basic staking had been separated from optional restaking, making the extra yield — and the extra risk — an explicit user choice.
This yielded a near-paradoxical positive outcome from the crisis: the sector became more cautious, architecture grew more transparent, and the line between staking and restaking risk became clearer to users.
Smart-contract capital became more top-heavy
Across the broader Aggregated Top-10,000, smart contracts actually lost ground over the summer. Their count dropped from 1,722 to 1,570, while total capital shrank from $88.6B to $86.5B.
At the very top of the Rich List, however, the opposite occurred. Within the Top-100, smart contract capital grew from $41.6B to $44.7B.
Viewing this through the lens of contract-capital concentration makes the trend even starker: in June, the Top-100 held roughly 47.0% of all smart contract capital across the Top-10,000. By September, that share had risen above half, to 51.7%.
The concentration could reflect two different dynamics: capital actively consolidating into top-tier contracts, or lower-ranked contracts simply losing value faster. The data cannot distinguish between the two, but either way, the structural shift is clear.
The Fastest-Growing Capital Sat Outside Known Project Labels
The final major shift of the season concerns not asset composition, but attribution levels.
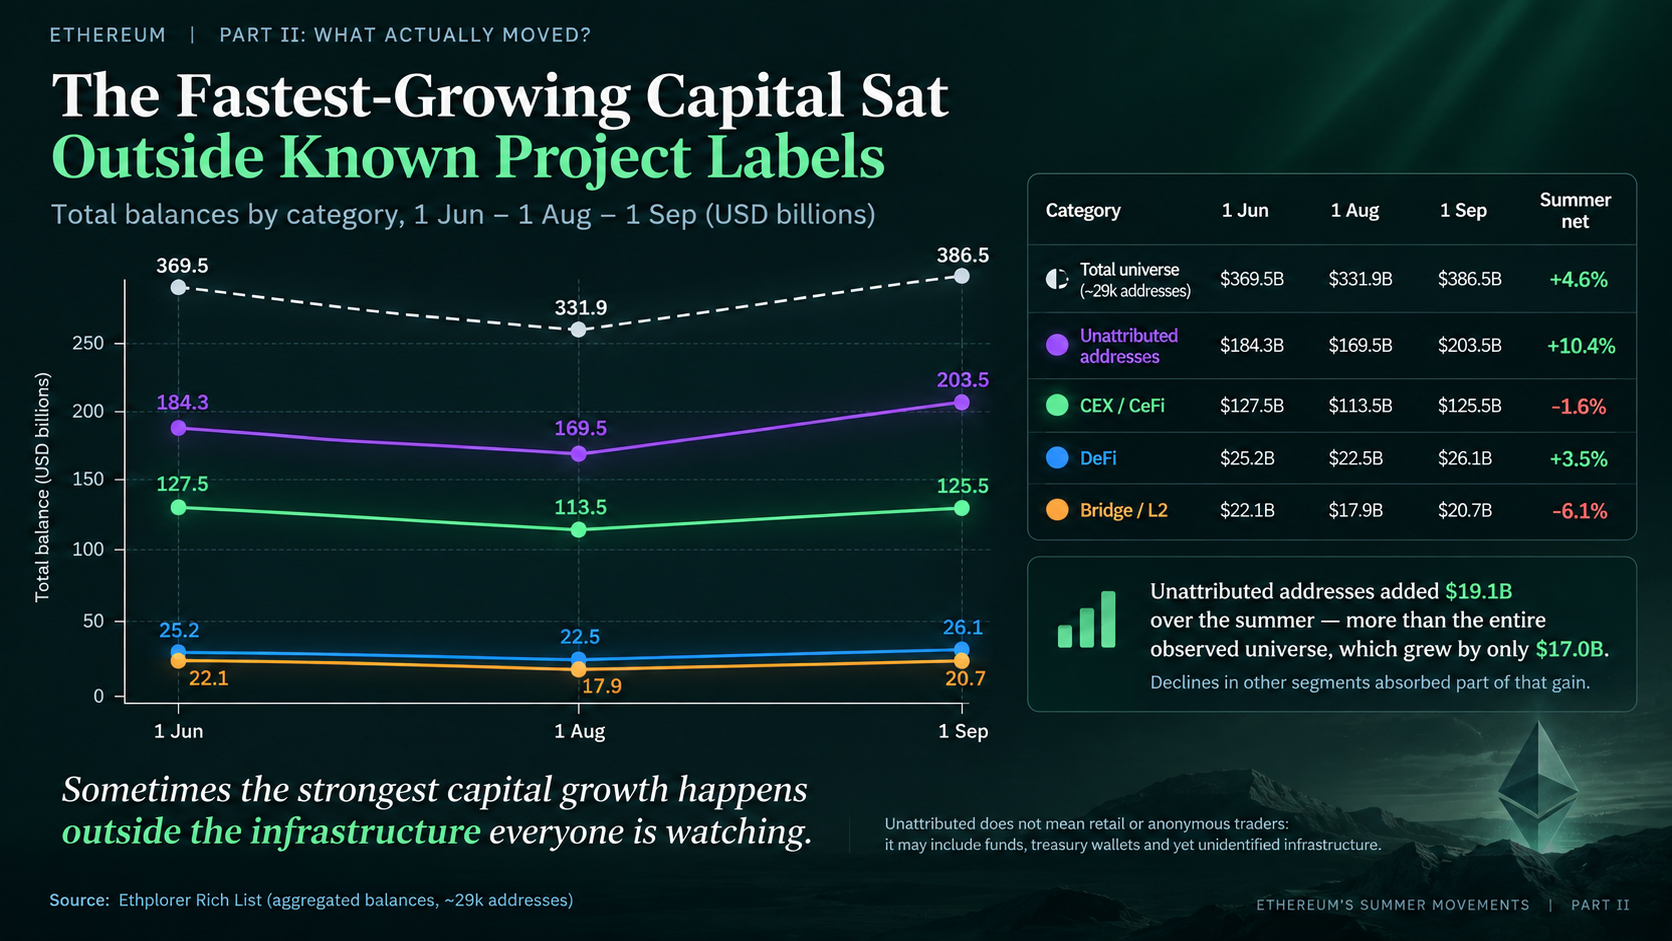
Across the full project-attribution universe, total observed capital grew by roughly 4.6% over the summer — from $369.5B to $386.5B. However, unattributed addresses expanded at a much faster pace: from $184.3B to $203.5B, a 10.4% gain.
As a result, their share of total observed capital rose from 49.9% to 52.6%, meaning that by the end of summer, over half of all tracked capital resided in addresses without explicit project labels.
For comparison, the three main categories of identified infrastructure — CEX/CeFi (-1.6%), DeFi (+3.5%), and Bridge/L2 (-6.1%) — collectively contracted by 1.5%. Thus, unattributed addresses served as the primary growth engine for the entire sample.
On the surface, balance growth outside established project labels outpaced that of the identified crypto infrastructure tracked here.
The strongest capital growth over the summer occurred outside the infrastructure labels everyone was watching.
Final Insight: From Balances to Behavior
Ethereum’s largest addresses ended the summer wealthier in dollar terms, but the capital behind those balances was not arranged as it had been in June. Liquid and wrapped ETH declined across the broader observed address universe while staking expanded. For several major projects, balance growth was driven largely by their own tokens. Smart-contract capital became more concentrated at the top, while unattributed addresses recorded the strongest growth across the observed project-attribution categories.
These changes show why headline balance growth is only a starting point. Understanding Ethereum’s capital also requires examining its composition, where it is held and how its uses are changing.
The market recovered. Its capital structure did not reset.