What’s your go-to tool for analyzing crypto market trends?
Whether you’re a casual or a professional crypto trader, you need the right tools. A simple assessment of the market can be tricky when free data is limited and you often need to use multiple sources and websites to get a read. And all you really want is to get a quick glance at market trends.
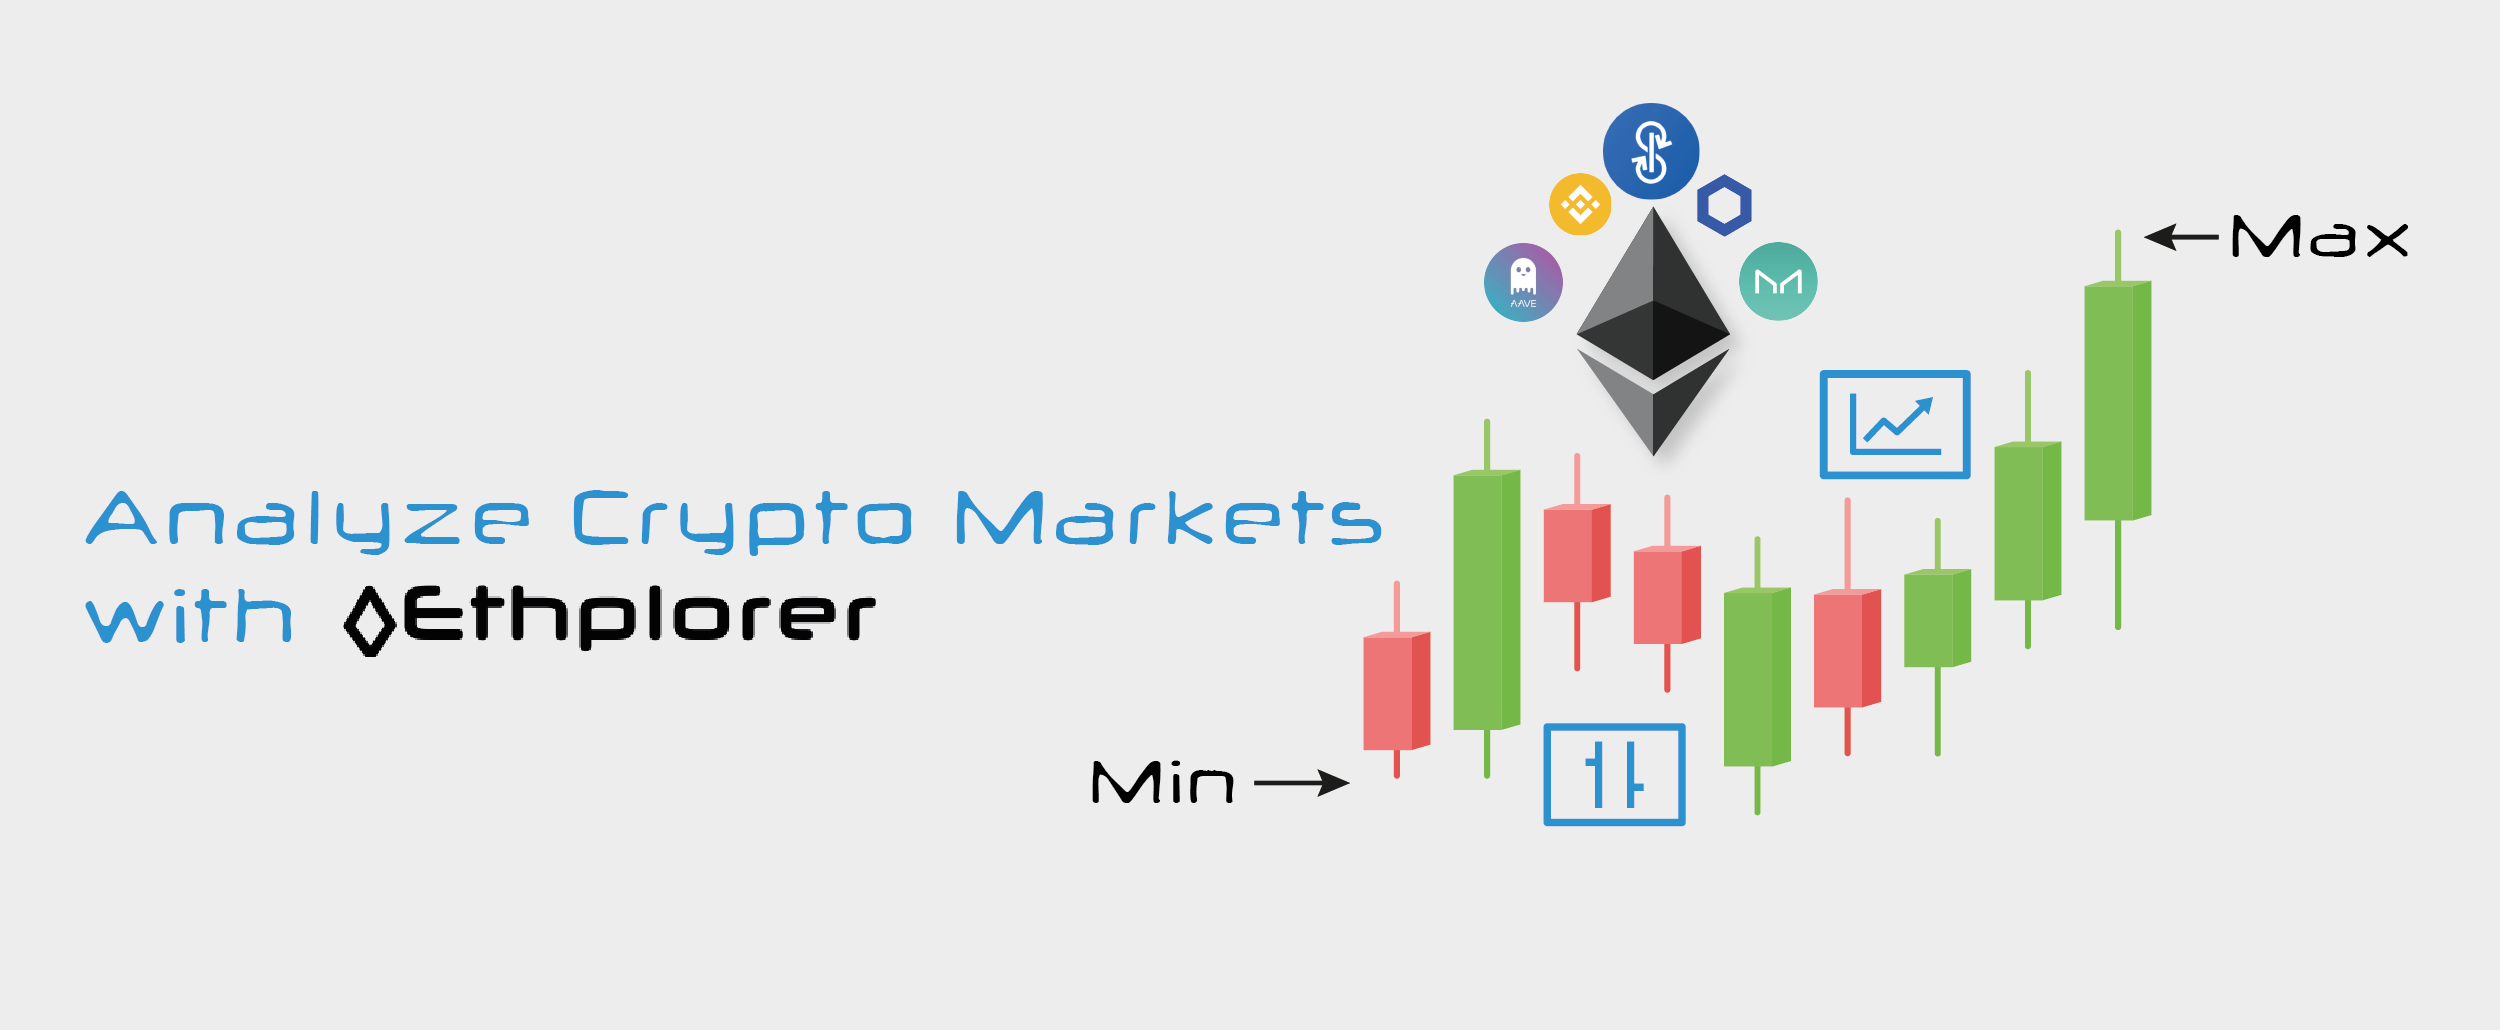
That's why Ethplorer has designed its easy-to-read charts to cater to the needs of the newbie crypto enthusiast in particular. We don’t want you to have to go back and forth between dozens of websites for information. We’ve built an all-in-one analysis platform with trading tools for even easier DYOR. It’s a real hub where budding crypto traders can grow into professional traders.
Here’s how to make the best use of Ethplorer, whatever you’re looking for:
DYOR on potential crypto projects
Perhaps you want to check the crypto charts for a particular token or address before you send money to a fintech organisation or new exchange.
You’ll need to:
- Check the project’s activity for potential
- Spot potential scams and avoid them
A very important piece of analysis, for example, is looking at the number of transactions within a particular time frame. But a single air drop event by the project can generate hundreds of transactions in just a few days... which may paint a misleading picture for a newbie.
Another thing to look out for would be the number of addresses holding the tokens and how the asset you are looking at is spread amongst them. If you find, for instance, that a token is spread over just a dozen addresses or, inversely, that it is spread over thousands of addresses — each of which holds just a handful of tokens — you could be looking at a scam.
On Ethplorer, you can easily research the state of publicly available entity addresses to spot indicators for healthy activity or suspicious blips.
Chart reading allows you - the trader - to analyze real activity for a project you want to invest in or follow. This way you can leave out all the media noise when decision-making to make sure you are on the right track.
An added bonus is that portfolio values on Ethplorer are shown in USD which is way more helpful when you are dealing with your accounts.
What’s great on Ethplorer also, is the user-friendly interface and that charts are fully functional on mobile and specifically designed to work with touch screens. So you can check the market daily from your phone!
Stay on top of current market trends
As you get into trading, you’ll want to do a technical analysis on current market trends. On Ethplorer charts you can detect bullish or bearish dominance using green or red candles. This feature helps you assess the daily minimum/maximum prices for an asset or address, not just daily.
This tool is available for any tokens or personal addresses, so you can keep track of your market position and get yourself ahead of the game.
Keep an eye on moving averages
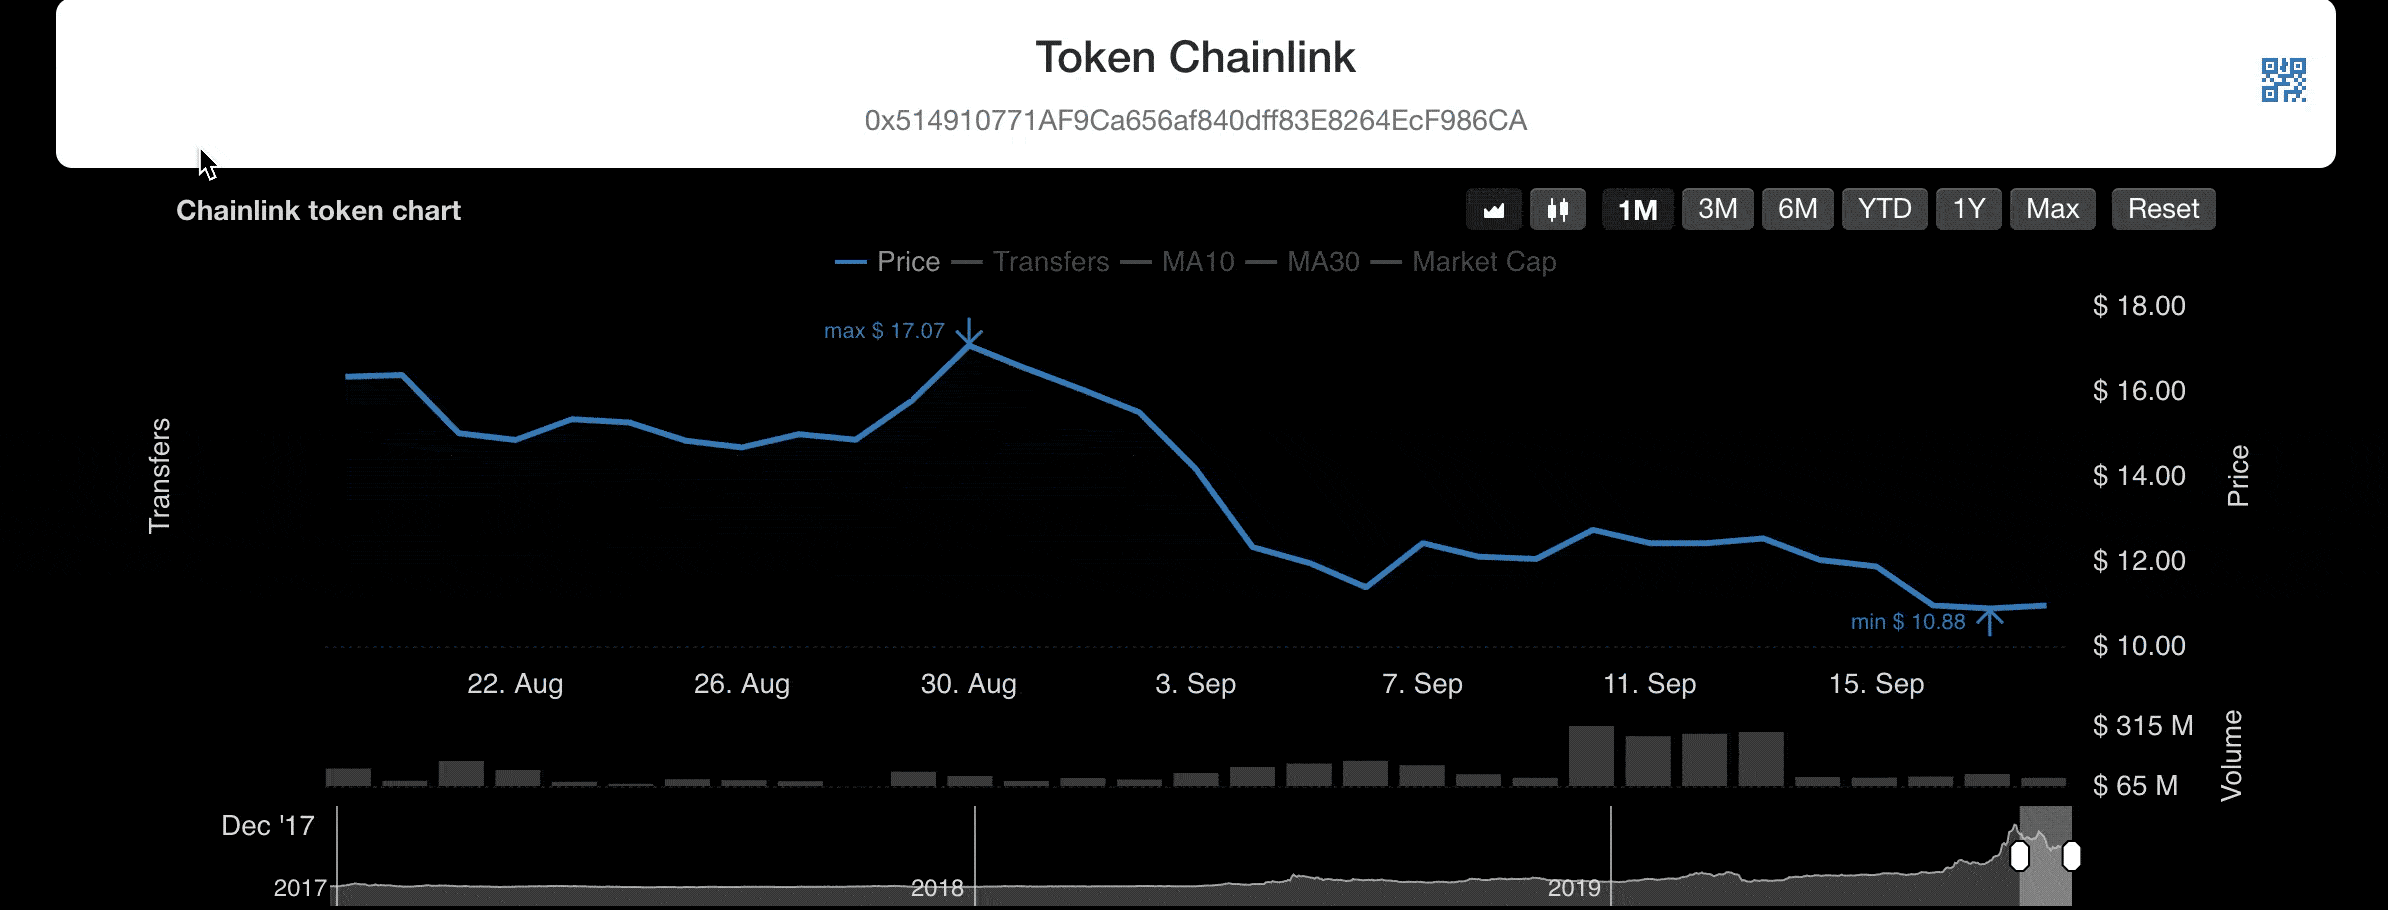
By watching the moving averages, as a trader you can assess the average token price over a certain time period. On Ethplorer you can choose between M10 or M30 to assess the average price for 10 days or 30 days. This analysis is great for detecting short-term bullish or bearish trends.
Follow potential crypto projects
To see the potential in a crypto project, you might want to check its fund flows and transactions. A project’s prospects can be estimated by the number of transfers shown on our charts. It’s always important to remember though, that some projects may (unfortunately) create an appearance of activity. Use Ethplorer to check, but do further research!
Know when token prices are rising
As a trader, you want to buy tokens at just the right time before the price surges. If the trade volume is rising it means more people are buying at the asking price, and as a result, the price is rising. Ethplorer displays trade volume data charts so traders can see what the token trade volume is like. And you - the trader - can get in at just the right time to make a trade!
Decide where to focus your interest
To know which crypto projects are worth your time, it’s important to have a complete understanding of the market evolution of the project you are interested in. The total project value displayed on Ethplorer helps you to understand if the project is worth your interest and your trade, or if it’s not. This way you don’t lose time on a project, and you can refocus elsewhere.
Ethplorer also provides charts to check highs and lows for the time periods you need. (The price changes on this chart according to scroll movement.)
Ethplorer provides the best set of tools for a quick scan of daily market trends. All the data that you need is there at your fingertips, so you can study historical data, detect patterns, predict market behavior, and identify trade opportunities. The charts are suitable for both technical and fundamental analysis, so they are perfect for newbie crypto traders. With everything you need all in one place, you’ll be pro trading in no time!
Try out Ethplorer charts here (and be sure to try it on your mobile) →